
Senior Design
Introduction
Magnetoelastic (ME) sensor is based on magnetostrictive material, allowing signal excitation and transmission through the magnetic field for passive wireless sensing of target parameters like mass accumulation.In this project, we analyzed the nature of the magnetoelastic sensor, made a simulation model, and proposed an optimization of the sensor.
Problem

1. Accomplish the numerical simulation of ME sensor based on MATLAB
2. Consider the influence of environmental factors
3. Optimize the geometry and dimension of the sensor while guarantee the performance
Solution
Work Flow Chart

Modeling
Sensor Parameters:

Table1. Sensor Parameters.
Our model uses Matglas 2826MB as the sensor material. This is an iron-based amorphous alloy film, which is more sensitive to small changes in quality. Its chemical element composition is Fe40Ni38Mo4B18. Table 1 provides us with detailed parameters.

Figure1. Sensor three-dimensional coordinate model
Resonant frequency of the sensor:
Fundamental resonant frequency is inversely proportional to the length of sensor

The resonant frequency shift is proportional to the ratio of loading mass to sensor mass

The resonant frequency shift is proportional to the square root of the product of fluid dynamic viscosity and density

Numerical Model
Notation definition:

Table2. Notation definition in MATLAB.
Determine the shape function:

The uneven distribution of the magnetic field along the sensor is described by shape function. The shape function depends on the length and width of the sensor. A and B are constant parameters.
Determine the sensor displacement:

Assume the displacement appears along the length of the sensor in the x-direction. It also varies with time.
Determine the ideal induced voltage:


where:
Assume that the receive coil is exactly wrapped around the ME sensor, which means it has no cross-sectional area. The magnetic induction in the sensor could be calculated by the inverse substitution of sensor displacement and integration. Then, applying Faraday's law of induction to obtain the induced voltage
Determine the non-ideal induced voltage:


where:
Under this condition, the receive coil has a relatively large cross-sectional area. The induced voltage of the receive coil voltage is the superposition of 3 components:
1. The induced voltage in the ideal condition.
2. The induced voltage caused by the magnetic flux in the space inside the coil.
3. The voltage caused by the magnetization of the sensor.
MATLAB Results
Basic Analysis:

Figure 2. Frequency response of our initial design, (a) Ideal induced voltage magnitude; (b) Non-ideal induced voltage magnitude; (c) Phase of the induced voltage; (d) Sensor displacement
- Sensor placed in the air
- Resonant Frequency: 140.48kHz
- Resonance and anti-resonance appears
Change Fluid-related parameters:


Figure 3. Frequency response of the sensor in the different fluids, (a) Ideal induced voltage magnitude; (b) Non-ideal induced voltage magnitude; (c) Phase of the induced voltage; (d) Sensor displacement

Table 3. Parameters of different fluids for simulation.
With fluid viscosity & density increase:
- Resonant frequency decreases
- Amplitude of frequency response decreases
- Quality factor decreases
Mass Loading:
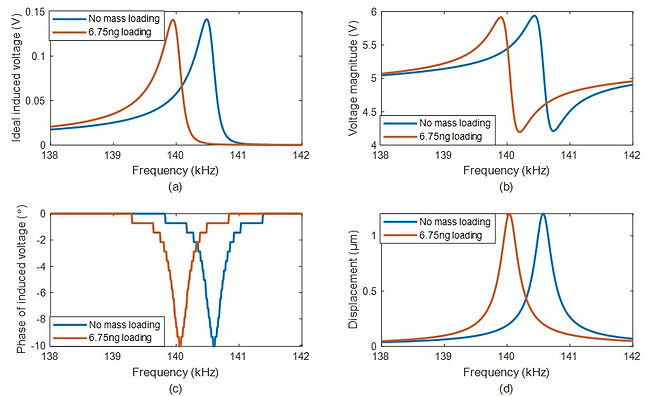
Figure 4. Frequency response of sensor with and without mass loading, (a) Ideal induced voltage magnitude; (b) Non-ideal induced voltage magnitude; (c) Phase of the induced voltage; (d) Sensor displacement
- Mass of loading is 6.75 ng
- Mass of the ME sensor is 1.7301μg
- Resonant frequency shift is 0.5481 kHz
Sensor Geometry:
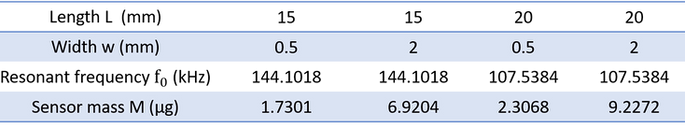
Table 4. Sensor geometry parameters for simulation

Table 5. Simulation results of different sensor geometries


Figure 5. Induced voltage magnitude
- 15mm sensor has a higher quality factor
- The lower mass sensor has the higher mass sensitivity
- Increasing the aspect ratio, the induced voltage magnitude decrease
Receive Coil Length:

Table 6. Simulation results of different coil lengths
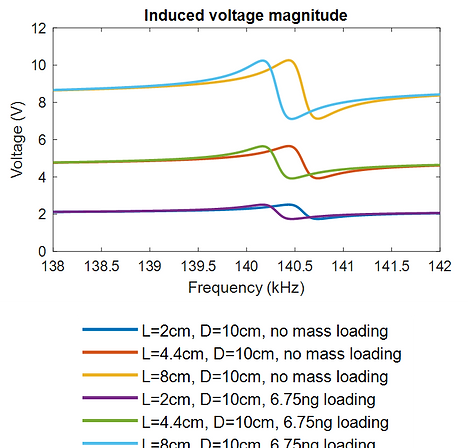
Figure 6. Induced voltage magnitude with different coil lengths
- Induced voltage magnitude increase with the coil length increasing.
- Mass sensitivity and quality factor remain constant.
Input Magnetic Field Intensity:

Figure 7. Induced voltage magnitude of different input magnetic field intensities

Table 7. Simulation results under different input magnetic field intensities
- Higher input magnetic field intensity leads to the higher induced voltage.
- Input magnetic field does not influence the mass sensitivity.
Optimization Design
According to simulations above, the optimum design is shown below:

Table 8. Parameters of the final design.
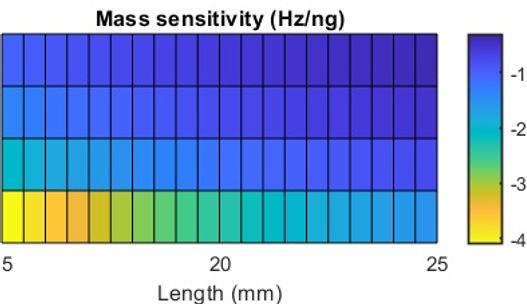
Figure 8. Mass sensitivity of sensors, with 15mm<L<25mm, 0.5mm<w<2.5mm
- 15mm*0.5mm*29.6μm sensor has the highest mass sensitivity.
- This sensor shows the largest relative dispacement as well.
Conclusion
1. Accomplished the simulation model in MATLAB
2. Adjusted parameters listed before, then analyzed the performance of the sensor.
3. The mass effect causes the resonant frequency to shift to left.
4. 15mm-sensor has a higher quality factor than the 20mm-sensor
5. Best sensor size: 15mm*0.5mm*29.6μm, since it has the highest mass sensitivity and relative displacement.